Go to the next level of reporting with BI Dashboards
-
Waiting for days to get the reports you ask for?
-
Fed up scrolling through endless columns in excel reports?
-
Switching between spreadsheets to get the information you are looking for?
-
Can’t trust the manual entries and formulas in the reports?
It’s time to move away from the traditional reports and join the Digital Transformation era through BI Dashboards

Benefits
BI Dashboards changes the way you interact with your data. It gives you the power to slice and dice the information in a way no other reports can do. In addition to the ability to produce complex KPI’s.
Lets have a look at the main benefits you get with BI Dashboards:
Connectivity
Direct Link to database, which makes it easier to extract reports, and reduces the time of report preparation.
Why Dashboards?
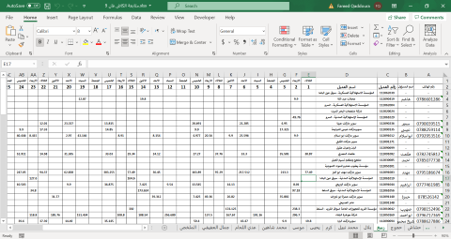
Like most businesses, you extract data from your system and dump it into Excel, and somehow this extracted data becomes your base for reporting. Let's see why this is not a practical way for reporting:
Excel
-
Mistakes in data entry and formulas
-
Scrolling through endless number of columns
-
Switching between a lot of sheets and files
-
File crashes, and huge amount of storage required
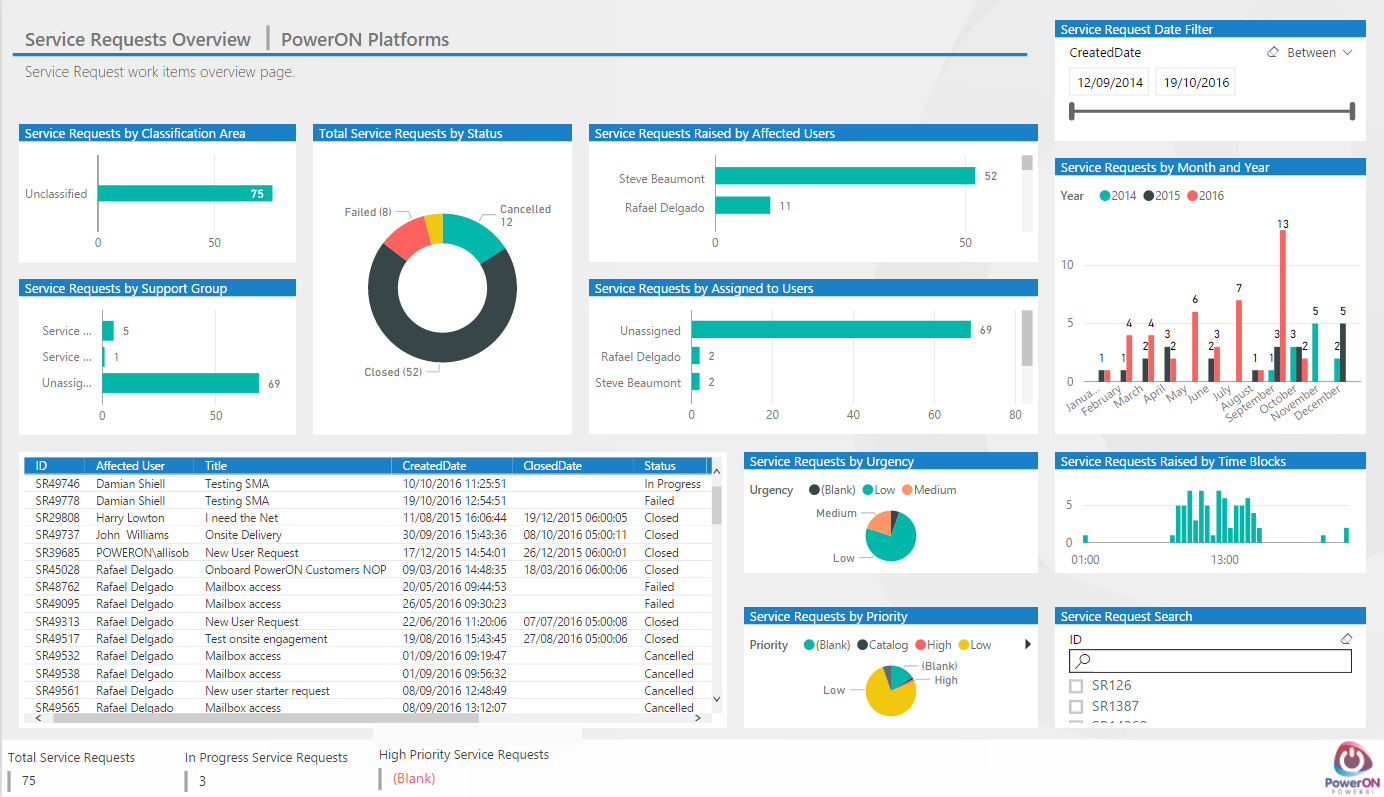
Dashboards
-
Accurate complex calculations (No room for error)
-
Dynamic filtering and drill down capabilities
-
Single Dashboard contains all the info you need
-
Live connection to database and auto refresh
Contact Us
Get in touch now and let us show you what we can do to improve your business!